Usage Statistics
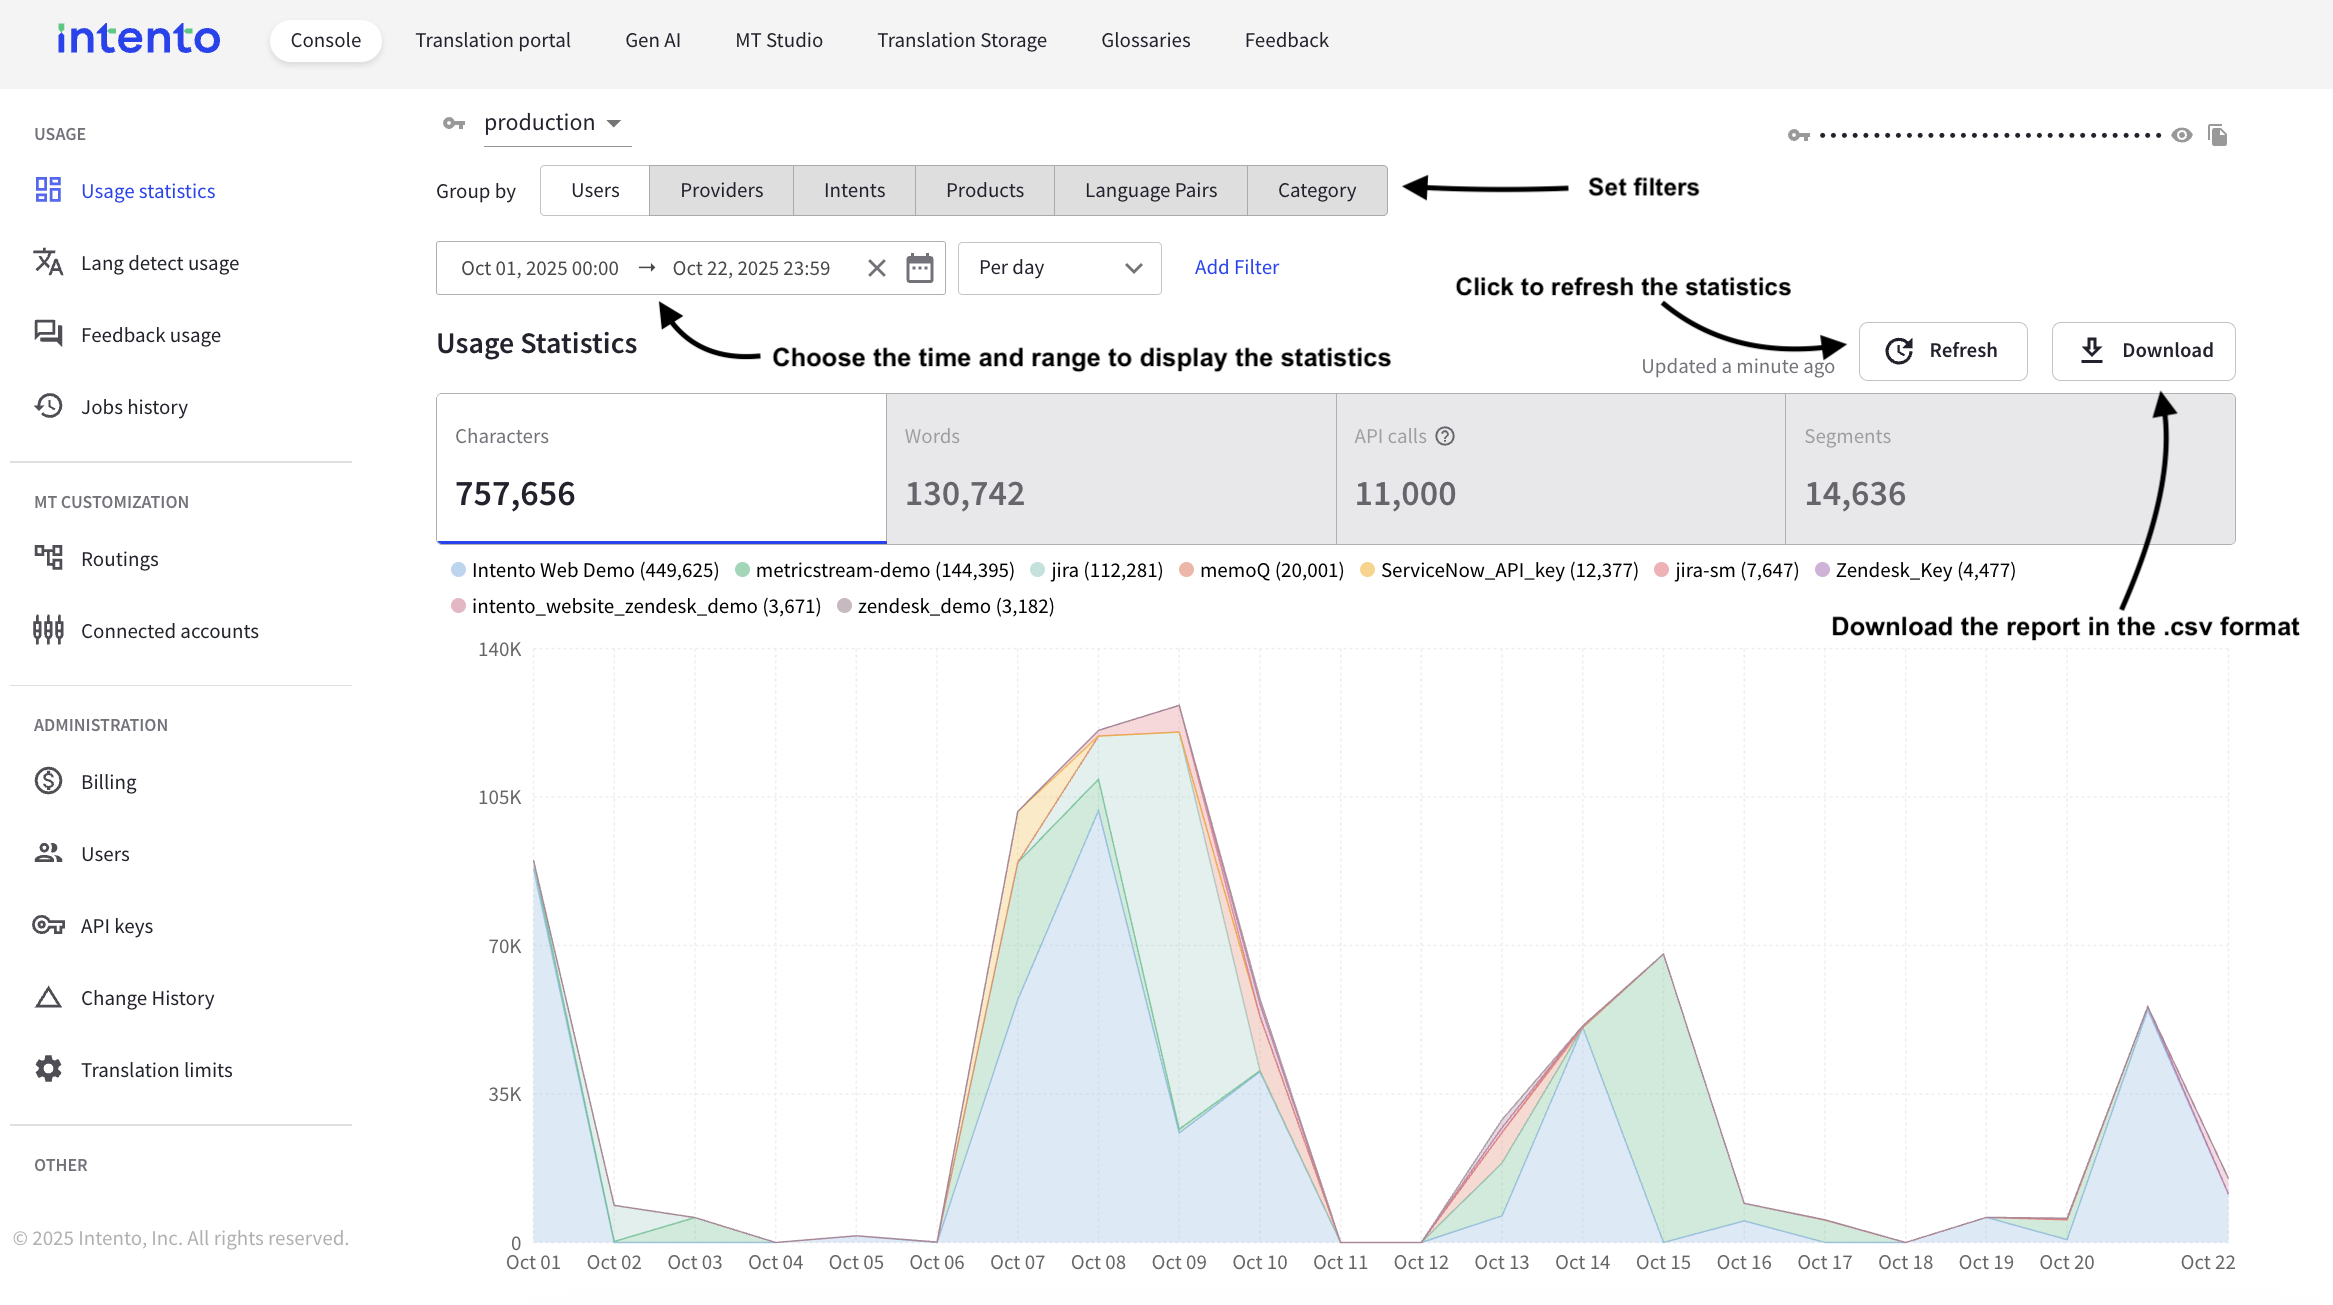
On the Intento Usage Statistics page, you can find available API keys and statistics, and by selecting filters, you can see different charts with data.
You can select a time range and group data by:
Users of your organization (if you have an Admin role);
Providers
Intents (API call types)
Products (Translation tools)
Language pairs
Categories (that filter shows if you used stock or custom models)
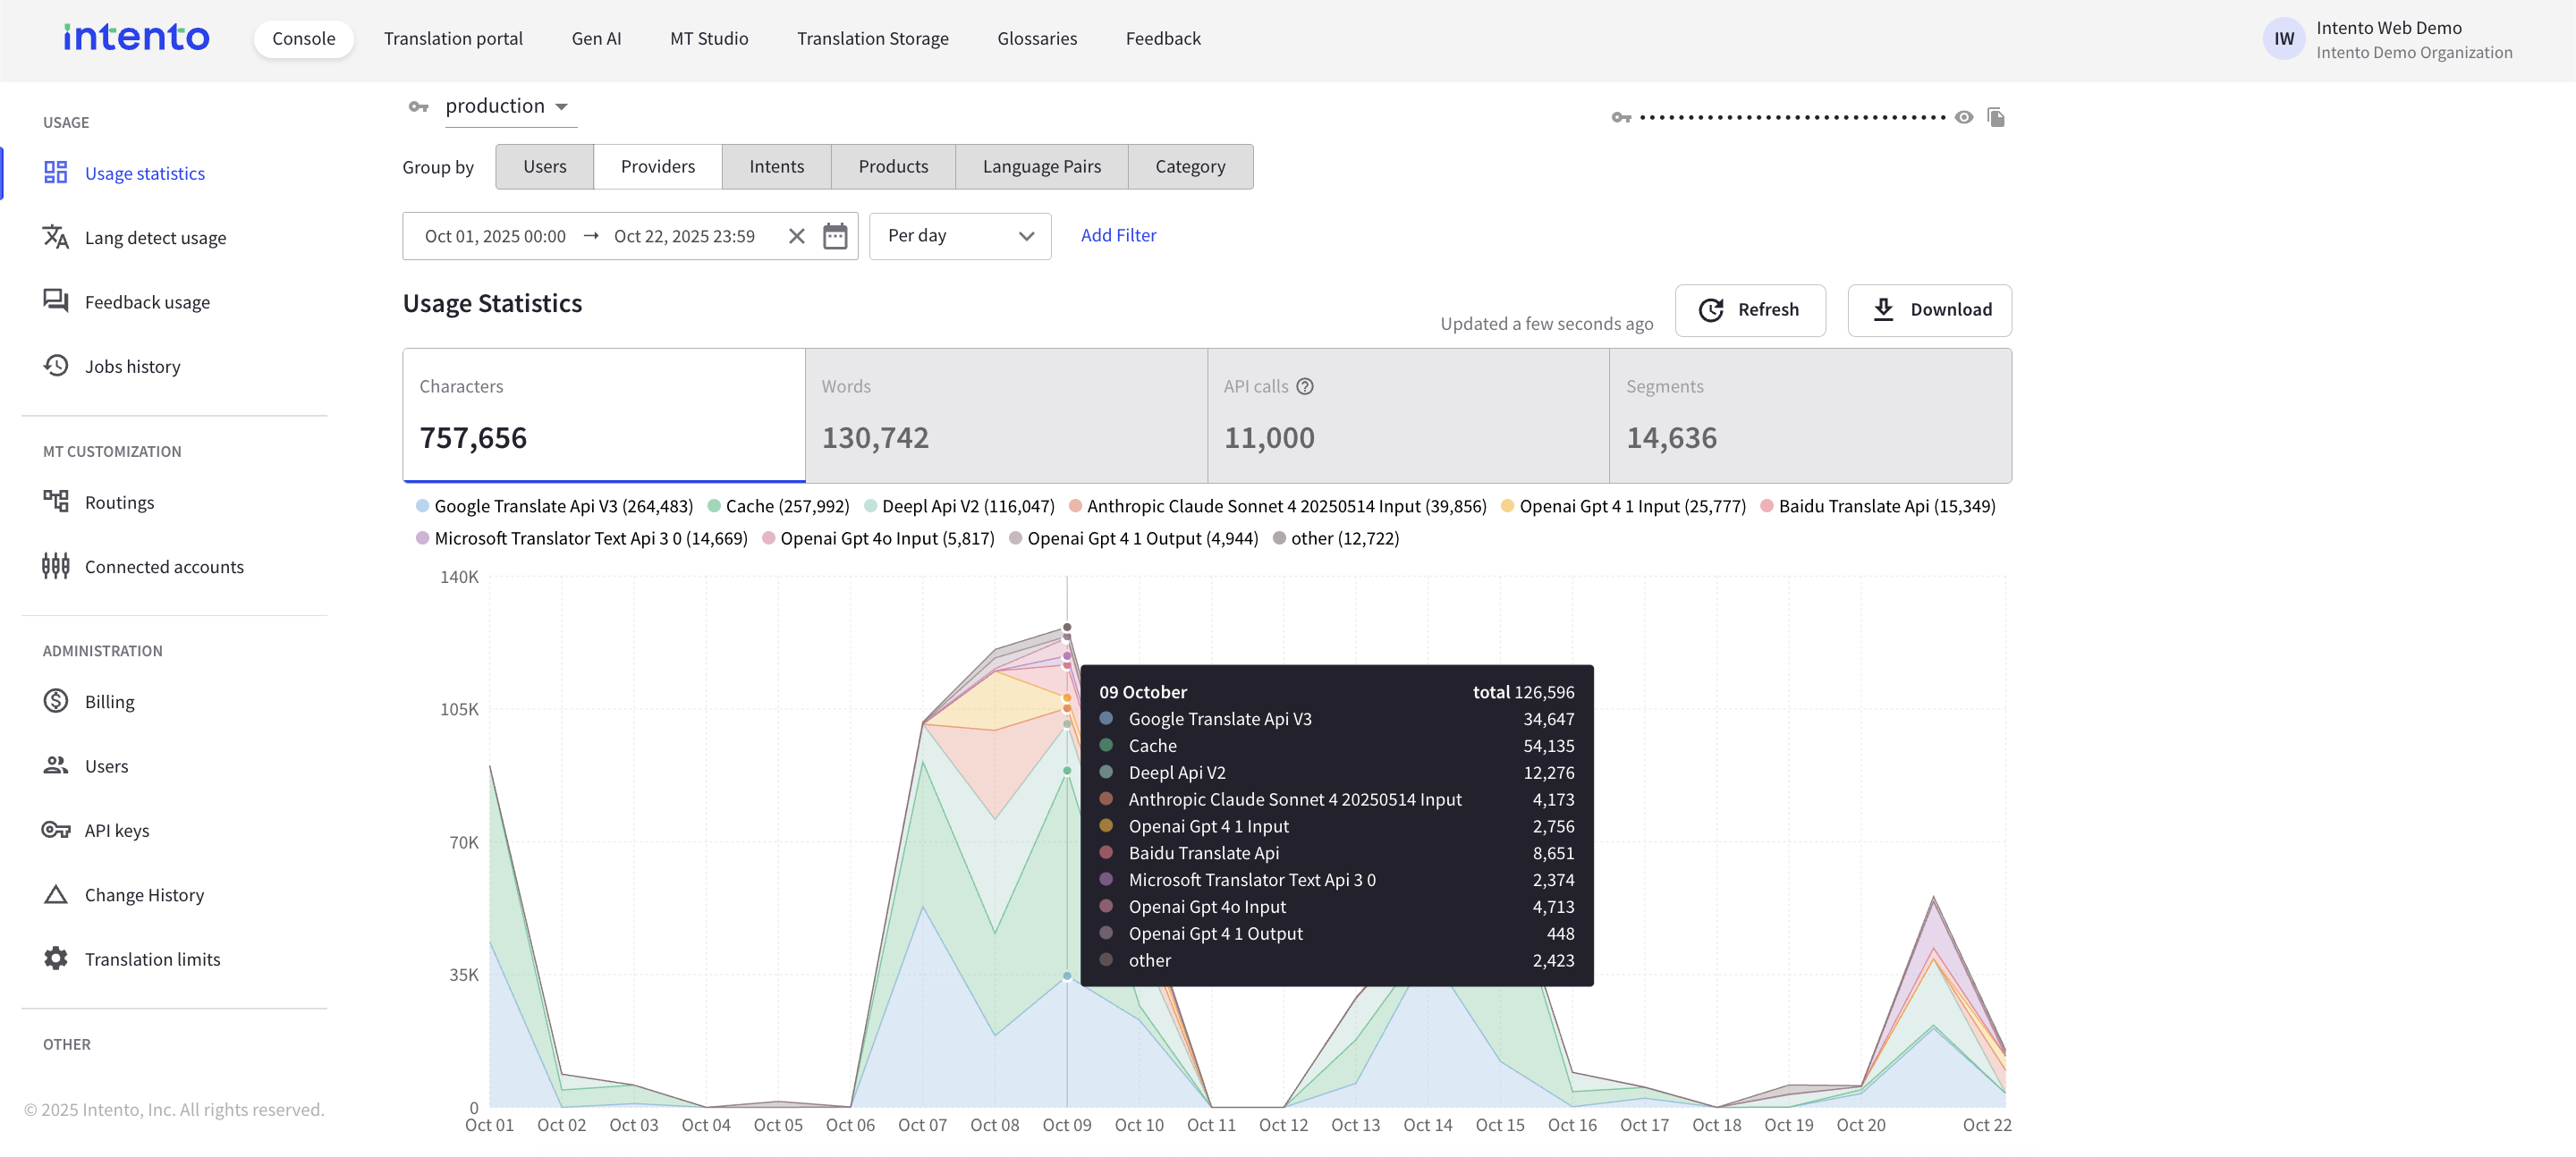
By hovering over the chart, you can see the number of characters translated on a specific day via different providers/tools/intents, depending on the filter you choose:
When you scroll through the page, you can see Error Statistics filtered by Intent, Machine Translation Provider, and Client errors.
You can always contact our Support Team (support@inten.to) for more details if you notice any errors.